


Time Series
A time series is a sequence of measurements, typically taken at successive points in time. Time series are used to identify trends and cycles. For example, a plot of the daily mean temperature as a function of day of year will clearly show the annual (or season) cycle in temperature, with cold winters and warm summers. A time series plot of the annual mean temperature as a function of year are often used to assess long term climate trends in temperature. It is very important that data has been collected over a long range of time when studying climate. Finally, time series plots are also used to determine if a particular year was an abnormal year.
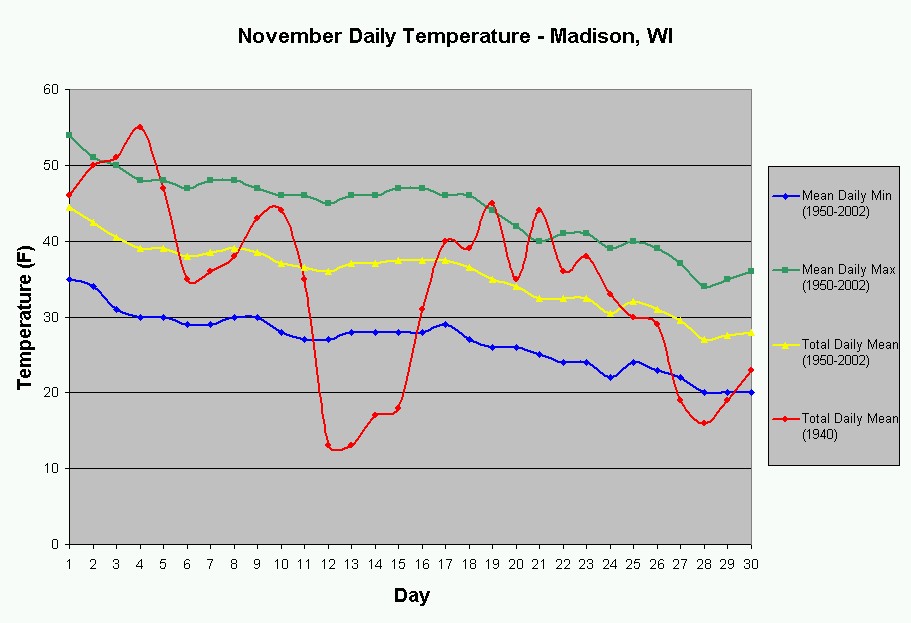
Examine the graph below. Compare the (red) line plot for November 1940, with that of November 1950-2002 depicted by the yellow line. November 1940 was an extremely abnormal month in terms of temperature, because of the Armistice Day Storm on the 11th. Since months like this are not common, we must average as many months as we can in order to get a more accurate description of a region’s typical climate.